Water pollution is one of the biggest fears for the green globalization. Water pollution affects human health by causing waterborne diseases. The goal of this project is to design and implement a working model of IoT based smart water supply management and monitoring system with Mobile/Web applications.
To prevent water pollution, considerable parameters like pH, turbidity, conductivity etc., needs to tested and controlled within consumable values as the variations in these parameters will lead to water pollutants.
In the present scenario, water parameters are detected in laboratories, where the testing equipment is stationery and samples are provided to the testing equipment. Thus, this manual system process is tedious and time consuming.
In order to save time and to make the system automated, the testing equipments can be placed inside the connecting pipe of river water/water supply. The detection of pollution can be made remotely by mobile/web applications. To ensure the safe supply of drinking water, the quality and water flow should be monitored in real time, for that purpose IoT based smart water supply management and monitoring system is proposed.
OBJECTIVES OF THE PROJECT:
- The main purpose of this smart water supply management and monitoring system is safe/direct drinking tap water, control and monitoring of water supply.
- It has impelled the development and implementation of new technologies, tools and approaches for optimizing the operation of water distribution system.
- To provides quick and efficient billing.
- To supply safer and consumable tap water to public.
CONCEPT OF THE PROJECT
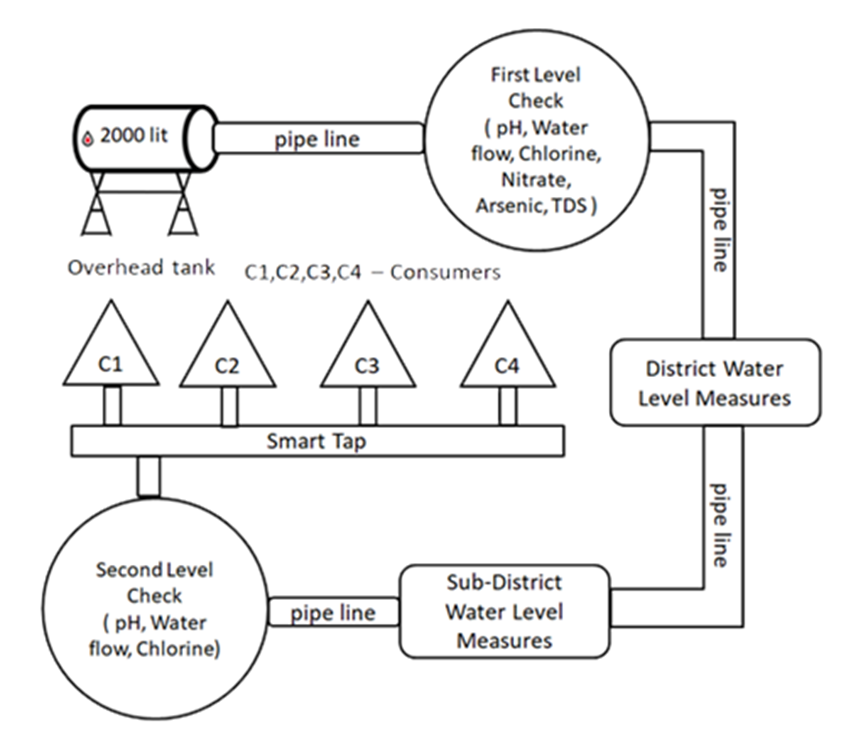
Our IoT module can be fixed inside the overhead tank/water pipeline. The module detects/sense water purity level, pH, TDS and water flow speed etc. The pipeline is connected to districts pipelines. The district pipelines measure and monitor the water levels. (Litres consumed in each district) The district pipelines are connected sub- districts pipelines. The sub-district pipelines measure and monitor the water levels. (Litres consumed in each sub-district) the sub- district pipelines are connected in smart taps in home lines.
The smart taps connected at the second level check the water parameters like pH, water flow and chlorine etc. These are completely monitored through mobile app and website. The data is transmitted using Wi-Fi/GSM.
Block Diagram:
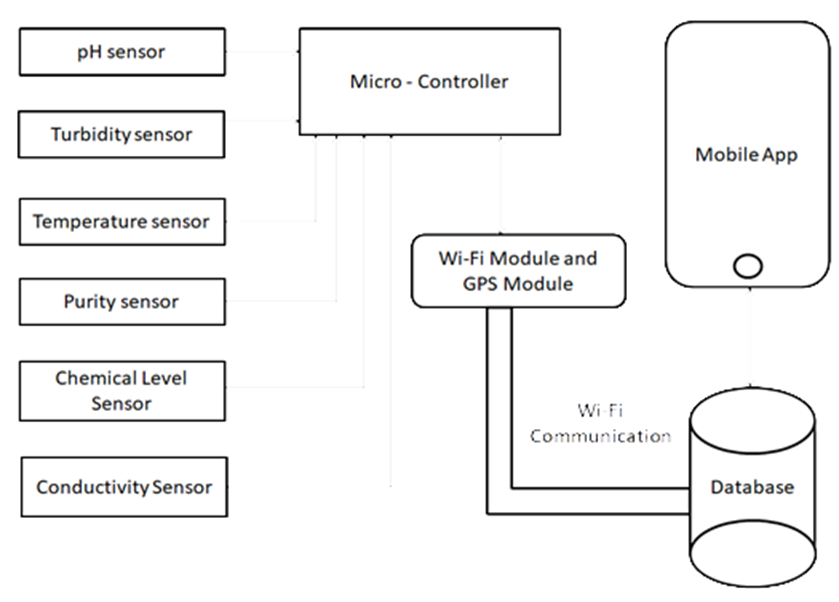
This proposed block diagram consists of several sensors (temperature, pH, turbidity, flow) connected to the core controller. The controller will access the sensor values and process them to transfer the data through internet. Arduino is used as a core controller. The output report is seen on the mobile/web application.
pH sensor:
- The pH of a solution is the measure of the acidity or alkalinity of that solution.
- The pH scale is a logarithmic scale whose range is from 0-14 with a neutral point being 7.
- Values above 7 indicate a basic or alkaline solution and values below 7 would indicate an acidic solution.
- It operates on 5-volt power supply and it is easy to interface with Arduino and the normal range of pH is 6 to 8.5.
Turbidity sensor:
- Turbidity is a measure of the cloudiness of water. Turbidity has indicated the degree at which the water loses its transparency.
- It is considered as a good measure of the quality of water.
- Turbidity blocks out the light needed by submerged aquatic vegetation.
- It also can raise surface water temperatures above normal because suspended particles near the surface facilitate the absorption of heat from sunlight.
Flow sensor:
- Flow sensor is used to measure the flow of water through the flow sensor.
- This sensor basically consists of a plastic valve body, a rotor and a Hall effect.
- The pinwheel rotor rotates when water / liquid flows through the valve and its speed will be directly proportional to the flow rate.
- The Hall effect sensor will provide an electrical pulse with every revolution of the pinwheel rotor.